With MR3-UI and Grafana
This page explains additional steps for running MR3-UI and Grafana along with Hive on MR3.
Setting environment variables
To run Grafana, we should set the environment variable
MR3_APPLICATION_ID_TIMESTAMP
before executing HiveServer2.
- Set
MR3_APPLICATION_ID_TIMESTAMPto a positive integer whose last four digits determine the name of the Service for exposing MR3 DAGAppMaster. It should be fixed in advance so that we can configure Prometheus which contacts MR3 DAGAppMaster to collect data (intimeline-conf/prometheus.yml).
Here are examples of setting
MR3_APPLICATION_ID_TIMESTAMP.
# set manually
export MR3_APPLICATION_ID_TIMESTAMP=9999

# generate random values
export MR3_APPLICATION_ID_TIMESTAMP=$RANDOM

# get the last four digits of MR3_APPLICATION_ID_TIMESTAMP
printf "%04d\n" ${MR3_APPLICATION_ID_TIMESTAMP: -4}
4679
To run MR3-UI and Grafana, we need to check or update the following files.
├── yaml
│   ├── mr3ui-service.yaml
│   ├── timeline-service.yaml
│   └── timeline.yaml
├── conf
│   └── mr3-site.xml
└── timeline-conf
    └── prometheus.yml
yaml/mr3ui-service.yaml
This manifest defines a Service for exposing MR3-UI to the outside of the Kubernetes cluster. The user should specify an IP address with a valid host name.
vi yaml/mr3ui-service.yaml

spec:
  externalIPs:
  - 192.168.10.1
yaml/timeline-service.yaml
This manifest defines a Service for exposing Grafana to the outside of the Kubernetes cluster. The user should specify an IP address with a valid host name.
vi yaml/timeline-service.yaml

spec:
  externalIPs:
  - 192.168.10.1
yaml/timeline.yaml
vi yaml/timeline.yaml

spec:
  template:
    spec:
      hostAliases:
      - ip: "192.168.10.1"
        hostnames:
        - "orange1"
      containers:
      - image: mr3project/mr3ui:1.5   # Prometheus
      - image: mr3project/mr3ui:1.5   # Grafana
- The
spec.hostAliasesfield lists aliases for hosts that may not be found in the default DNS. It should include the host assigned to the Service created in the previous step. - The
imagefield in thespec.containerssection specifies the Docker image for Grafana.
PersistentVolumeClaim
Grafana uses the PersistentVolumeClaim workdir-pvc created for Hive on MR3.
The PersistentVolume should be writable to the user with UID 1000.
To use local directories inside the Docker containers instead
(e.g., if PersistentVolumeClaim is not created for Hive on MR3),
comment out the following lines.
vi yaml/timeline.yaml

# - name: timeline-work-dir-volume
#   mountPath: /opt/mr3-run/ats/prometheus/data/
#   mountPath: /opt/mr3-run/ats/grafana/data/

# - name: timeline-work-dir-volume
#   persistentVolumeClaim:
#     claimName: workdir-pvc
conf/mr3-site.xml
The following configuration keys should be set to true in order for MR3 DAGAppMaster to send data to 1) the Timeline Server for MR3-UI and 2) Prometheus.
vi conf/mr3-site.xml

<property>
  <name>mr3.app.history.logging.enabled</name>
  <value>true</value>
</property>

<property>
  <name>mr3.dag.history.logging.enabled</name>
  <value>true</value>
</property>

<property>
  <name>mr3.ui.create.server</name>
  <value>true</value>
</property>

<property>
  <name>mr3.prometheus.enable.metrics</name>
  <value>true</value>
</property>
By default,
MR3 DAGAppMaster uses the PersistentVolumeClaim workdir-pvc
to store the database for its internal Timeline Server.
Update the following configuration key to change the directory for storing the database
(e.g., /tmp/leveldb inside the Docker image).
vi conf/mr3-site.xml

<property>
  <name>mr3.ui.timeline-service.leveldb-timeline-store.path</name>
  <value>/opt/mr3-run/work-dir/leveldb</value>
</property>
timeline-conf/prometheus.yml
This file configures the Prometheus server.
The field static_configs/targets should specify the address of MR3 DAGAppMaster,
so use the last four digits of MR3_APPLICATION_ID_TIMESTAMP
(e.g., 9999 in service-master-9999-0).
vi timeline-conf/prometheus.yml

    static_configs:
      - targets: ["service-master-9999-0.hivemr3.svc.cluster.local:9890", "service-master-9999-0.hivemr3.svc.cluster.local:9890"]
Running MR3-UI and Grafana
To expose MR3-UI to the outside of the Kubernetes cluster,
use the manifest yaml/mr3ui-service.yaml.
In order to run Grafana, execute the script run-timeline.sh.
./run-metastore.sh
./run-hive.sh
kubectl create -f yaml/mr3ui-service.yaml
service/mr3-ui created
./run-timeline.sh
Error from server (AlreadyExists): namespaces "hivemr3" already exists
Error from server (AlreadyExists): secrets "env-secret" already exists
configmap/hivemr3-timeline-conf-configmap created
configmap/client-timeline-config created
statefulset.apps/hivemr3-timeline created
service/timeline created
The Grafana Pod runs two containers.
kubectl get pods -n hivemr3
NAME                                   READY   STATUS    RESTARTS   AGE
hivemr3-hiveserver2-7fbb4cb8c4-8hbfs   0/1     Running   0          2m56s
hivemr3-metastore-0                    1/1     Running   0          3m
hivemr3-timeline-0                     2/2     Running   0          56s
mr3master-6598-0-79bd5cc458-wckn7      1/1     Running   4          2m36s
Accessing MR3-UI and Grafana
The ports assigned to MR3-UI and Grafana can be found in
yaml/mr3ui-service.yaml and
yaml/timeline-service.yaml.
vi yaml/mr3ui-service.yaml
spec:
  ports:
  - protocol: TCP
    port: 19003
    targetPort: 19003

vi yaml/timeline-service.yaml

spec:
  ports:
  - name: grafana
    port: 3000
    targetPort: 3000
In our example,
the host assigned to the Service for MR3-UI and Grafana is orange1,
so we access MR3-UI and Grafana at the following URLs.
- MR3-UI:
http://orange1:19003 - Grafana:
http://orange1:3000
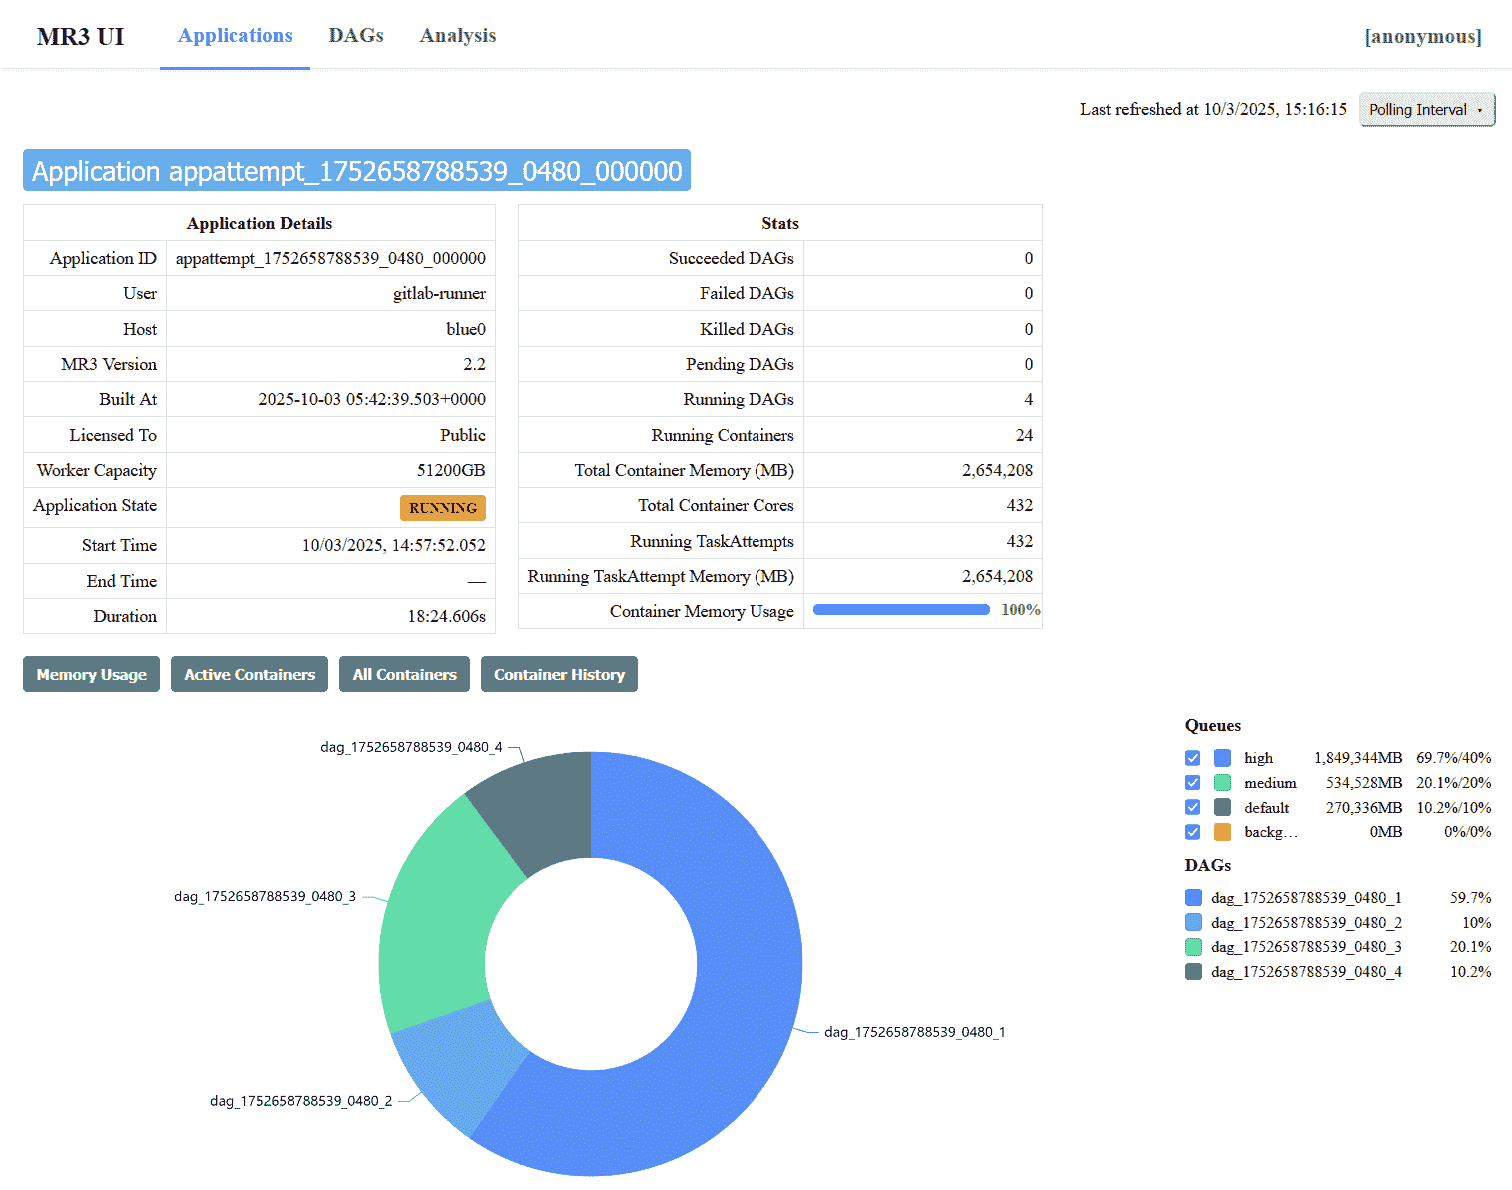
MR3-UI shows details of DAGs executed by MR3 for Hive.
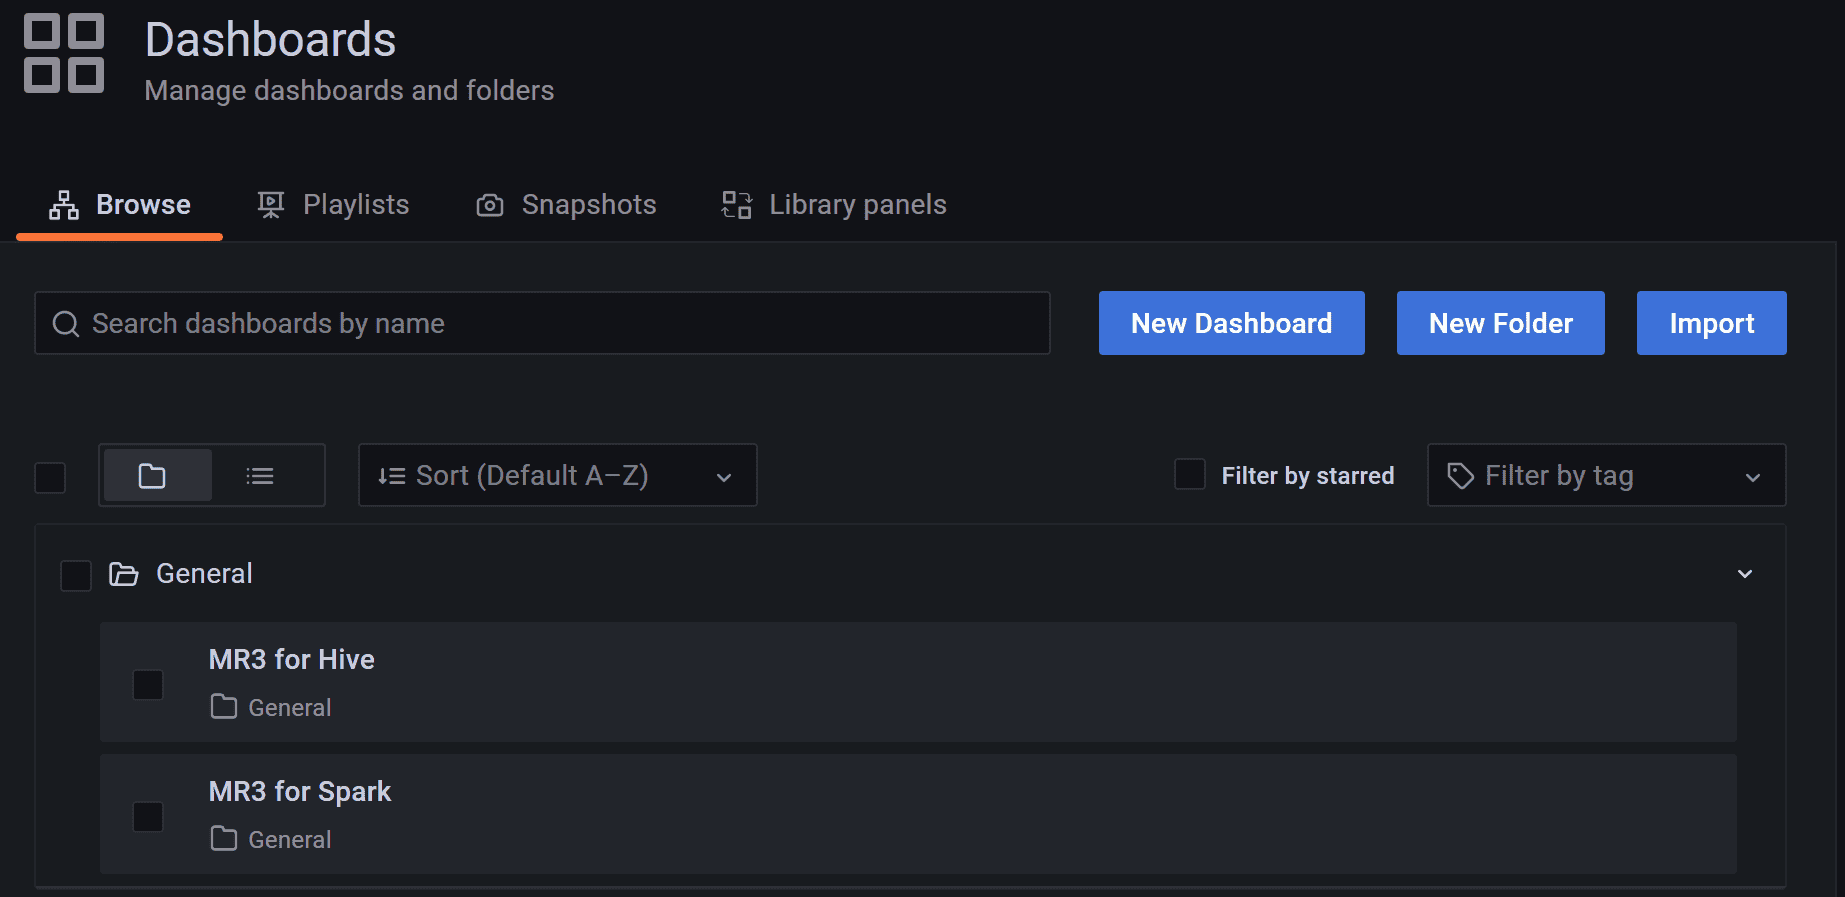
For Grafana,
the password for the user admin is initialized to admin,
and can be changed after the first login.
The user can watch MR3 for Hive on the dashboard MR3 for Hive.