Grafana
Running Grafana in a Docker container
The user can create a Docker container to run Grafana which reads from the Prometheus server for MR3. Below we demonstrate how to run Grafana using a pre-built Docker image from DockerHub (mr3project/mr3ui).
Open kubernetes/run-grafana-docker.sh and set the following variables.
vi kubernetes/run-grafana-docker.sh

DOCKER_MR3UI_IMG=mr3project/mr3ui:1.5
GRAFANA_WORK_DIR=/home/hive/grafana

LOCAL_HOST=192.168.10.101
LOCAL_PORT_GRAFANA_HTTP=3000
DOCKER_MR3UI_IMGis set to the Docker image for MR3-UI (which includes environments for running Grafana).GRAFANA_WORK_DIRpoints to the local directory where Grafana stores its internal data. The directory should be writable to user with the user with UID 1000.LOCAL_HOSTis set to the IP address of the local host where a Docker container is created.LOCAL_PORT_GRAFANA_HTTPis set to the port for connecting to Grafana.
Open kubernetes/timeline-conf/mr3.yaml and set the field datasources/url to the address of the Prometheus server created in the previous step.
vi kubernetes/timeline-conf/mr3.yaml

datasources:
    url: http://192.168.10.101:9090
Finally the user can execute kubernetes/run-grafana-docker.sh
to start Prometheus in a Docker container.
kubernetes/run-grafana-docker.sh
Accessing Grafana
For Grafana,
the password for the user admin is initialized to admin,
and can be changed after the first login.
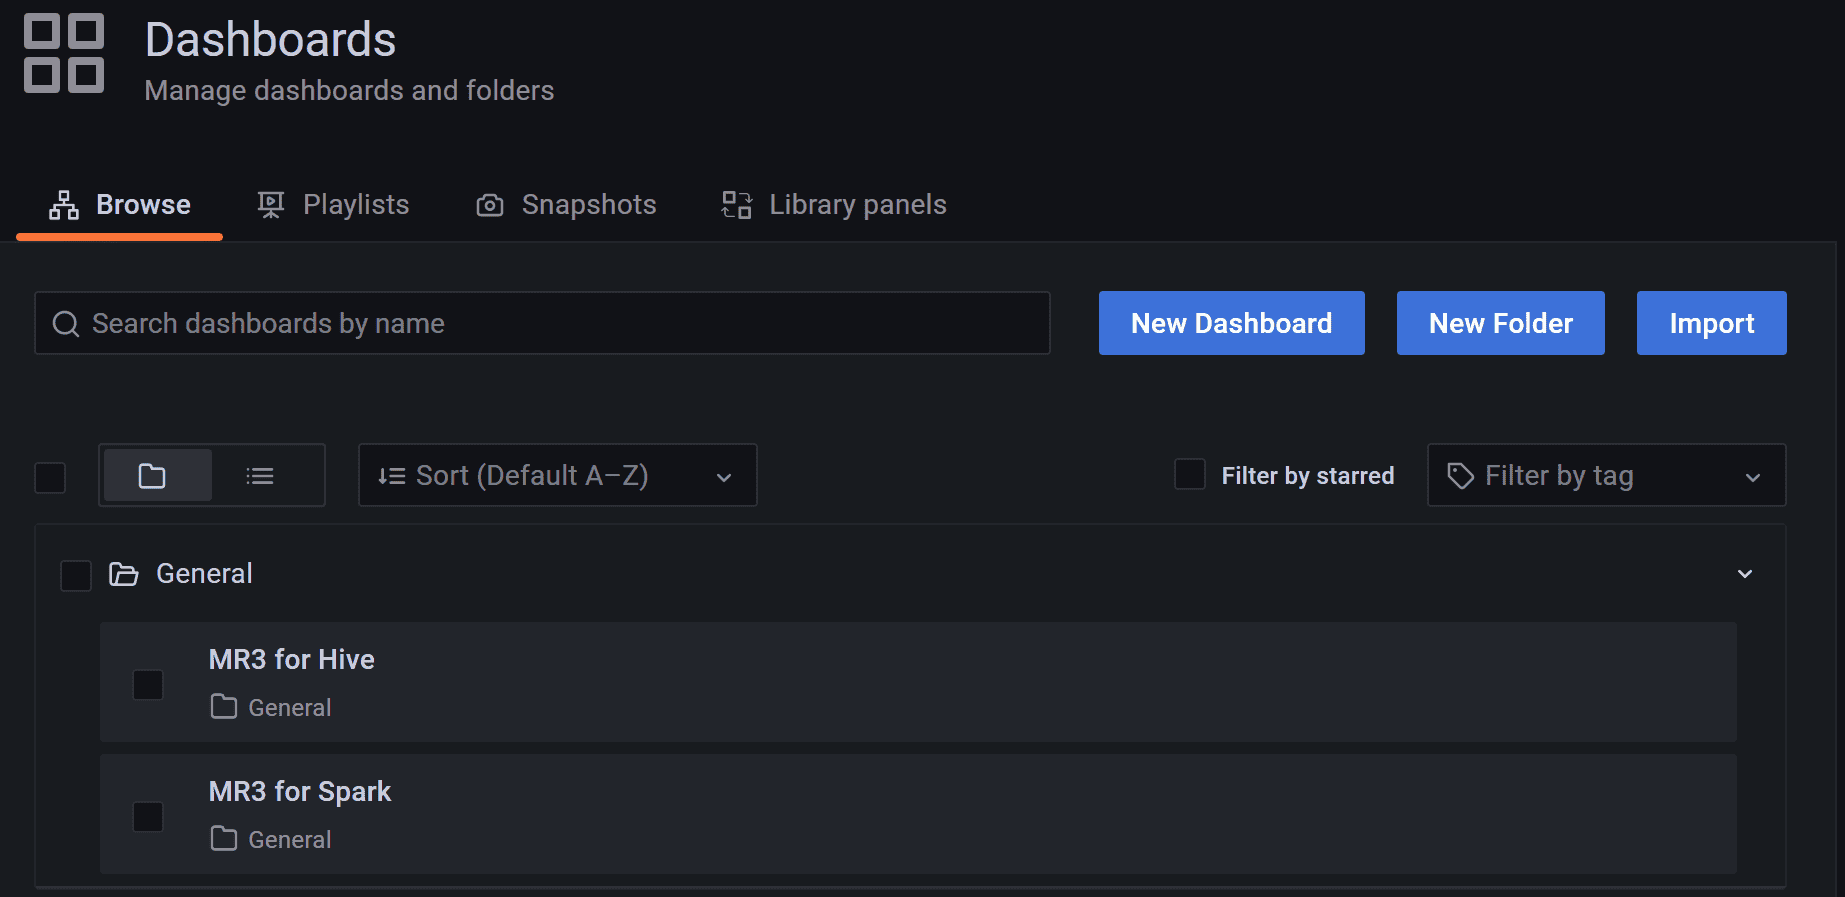
The user can watch MR3 on the dashboard MR3 for Hive.