Prometheus for DAGAppMaster
DAGAppMaster can run a Prometheus client to report the statistics on DAGs as well as the states of Java VM.
- If the configuration key
mr3.prometheus.enable.metricsis set to true inmr3-site.xml, DAGAppMaster runs a Prometheus client which creates an HTTP server on port specified by the configuration keymr3.prometheus.httpserver.port. - By default, the Prometheus client exports metrics on DAGs only.
- The user can export metrics on Java VM as well
(from
io.prometheus.client.hotspot.DefaultExports) by setting the configuration keymr3.prometheus.enable.jvm.metricsto true. - DAGAppMaster updates the metrics at an interval specified by the configuration key
mr3.check.memory.usage.event.interval.secs.
The following table shows all the metrics on DAGs.
Except for the metric mr3_dags and those starting with mr3_dags_total,
every metric is associated with a ContainerGroup whose ID is used as its label.
For example,
a metric mr3_heap_bytes_max reports the aggregate size of the Java heap of ContainerWorkers belonging to a particular ContainerGroup.
Hence, if multiple ContainerGroups coexist,
the total size of the Java heap of all ContainerWorkers can be obtained as the sum of all such metrics.
In particular, if the configuration key mr3.container.stop.cross.dag.reuse is set to true,
a new metric is exported for each DAG which creates its own ContainerGroup.
| Name | Type | Description |
|---|---|---|
mr3_dags |
Gauge | Number of running DAGs |
mr3_dags_total |
Counter | Total number of DAGs |
mr3_dags_total_succeeded |
Counter | Total number of DAGs that succeeded |
mr3_dags_total_failed |
Counter | Total number of DAGs that failed |
mr3_dags_total_killed |
Counter | Total number of DAGs killed |
mr3_containers |
Gauge | Number of ContainerWorkers |
mr3_queued_tasks |
Gauge | Number of TaskAttempts in queue |
mr3_running_tasks |
Gauge | Number of running TaskAttempts |
mr3_nodes |
Gauge | Number of nodes where ContainerWorkers are running |
mr3_heap_bytes_max |
Gauge | Aggregate size of the Java heap |
mr3_heap_bytes_used |
Gauge | Aggregate size of the Java heap in use |
mr3_heap_window_bytes_max |
Gauge | Averaged aggregate size of the Java heap |
mr3_heap_window_bytes_used |
Gauge | Averaged aggregate size of the Java heap in use |
mr3_heap_window_usage_percent |
Gauge | Averaged Java heap usage in percentage |
mr3_containers_total |
Counter | Total number of ContainerWorkers |
mr3_completed_tasks_total |
Counter | Total number of completed TaskAttempts |
mr3_succeeded_tasks_total |
Counter | Total number of TaskAttempts that succeeded |
mr3_failed_tasks_total |
Counter | Total number of TaskAttempts that failed |
mr3_killed_tasks_total |
Counter | Total number of TaskAttempts killed |
Running a Prometheus server in a Docker container
The user can create a Docker container to run a Prometheus server which reads from DAGAppMaster. Below we demonstrate how to run a Prometheus Server using a pre-built Docker image from DockerHub (mr3project/mr3ui).
Open kubernetes/run-prometheus-docker.sh and set the following variables:
$ vi kubernetes/run-prometheus-docker.sh

DOCKER_MR3UI_IMG=mr3project/mr3ui:1.5
PROMETHEUS_WORK_DIR=/home/hive/prometheus

LOCAL_HOST=192.168.10.101
LOCAL_PORT_PROMETHEUS_HTTP=9090
DOCKER_MR3UI_IMGis set to the Docker image for MR3-UI (which includes environments for running a Prometheus server).PROMETHEUS_WORK_DIRpoints to the local directory where the Prometheus server stores its internal data. The directory should be writable to user with the user with UID 1000.LOCAL_HOSTis set to the IP address of the local host where a Docker container is created.LOCAL_PORT_PROMETHEUS_HTTPis set to the port for connecting to the Prometheus server.
Open kubernetes/timeline-conf/prometheus.yml and set the field scrape_configs/static_configs/targets to the address of the Prometheus client running inside DAGAppMaster.
$ vi kubernetes/timeline-conf/prometheus.yml

scrape_configs:
    static_configs:
      - targets: ["192.168.10.101:9890"]
Finally the user can execute kubernetes/run-prometheus-docker.sh
to start a Prometheus server in a Docker container.
$ kubernetes/run-prometheus-docker.sh
Running Grafana in a Docker container
The user can create a Docker container to run Grafana which reads from the Prometheus server created in the previous step. Below we demonstrate how to run Grafana using a pre-built Docker image from DockerHub (mr3project/mr3ui).
Open kubernetes/run-grafana-docker.sh and set the following variables:
$ vi kubernetes/run-grafana-docker.sh

DOCKER_MR3UI_IMG=mr3project/mr3ui:1.5
GRAFANA_WORK_DIR=/home/hive/grafana

LOCAL_HOST=192.168.10.101
LOCAL_PORT_GRAFANA_HTTP=3000
DOCKER_MR3UI_IMGis set to the Docker image for MR3-UI (which includes environments for running Grafana).GRAFANA_WORK_DIRpoints to the local directory where Grafana stores its internal data. The directory should be writable to user with the user with UID 1000.LOCAL_HOSTis set to the IP address of the local host where a Docker container is created.LOCAL_PORT_GRAFANA_HTTPis set to the port for connecting to Grafana.
Open kubernetes/timeline-conf/mr3.yaml and set the field datasources/url to the address of the Prometheus server created in the previous step.
$ vi kubernetes/timeline-conf/mr3.yaml

datasources:
    url: http://192.168.10.101:9090
Finally the user can execute kubernetes/run-grafana-docker.sh
to start Prometheus in a Docker container.
$ kubernetes/run-grafana-docker.sh
For Grafana,
the password for the user admin is initialized to admin,
and can be changed after the first login.
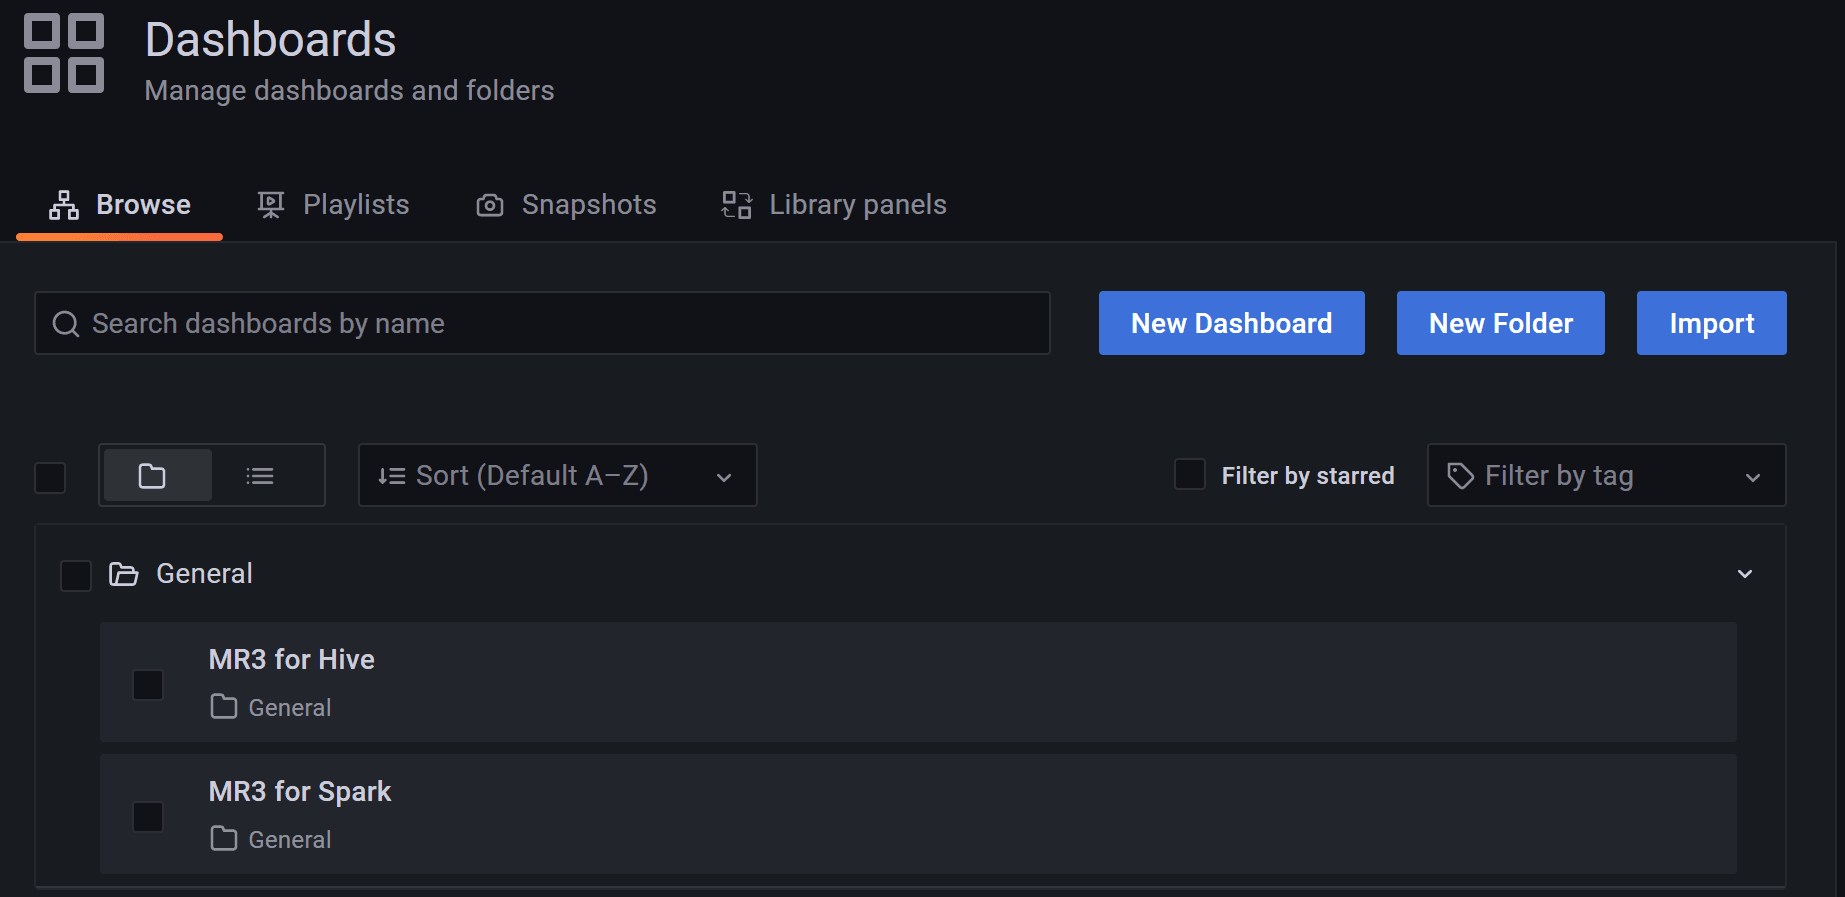
The user can watch MR3 on the dashboard MR3 for Hive.
Creating a Service on Kubernetes
On Kubernetes, the user may want to create a Service for exposing the HTTP server of DAGAppMaster to the outside of the Kubernetes cluster. Without such a Service, the Prometheus server should run inside the Kubernetes cluster and use the IP address of the DAGAppMaster Pod assigned by Kubernetes.
Creating a Service for exposing the HTTP server of DAGAppMaster takes two steps.
First the user should set the environment variable CREATE_PROMETHEUS_SERVICE to true in kubernetes/env.sh.
CREATE_PROMETHEUS_SERVICE=true
Now the script kubernetes/run-hive.sh creates a Service from the YAML file kubernetes/yaml/prometheus-service.yaml.
By default, it creates a Service of type LoadBalancer, but the user can customize the Service by updating the YAML file.
For example, the user can use a different public IP address by changing the field spec/externalIPs.
(It is okay to use the same public IP address that HiveServer2 Service uses as long as a different port is specified.)
Second
the user should add a label hivemr3_aux=prometheus to the DAGAppMaster Pod
by setting the configuration key mr3.k8s.master.pod.additional.labels in kubernetes/conf/mr3-site.xml.
<property>
  <name>mr3.k8s.master.pod.additional.labels</name>
  <value>hivemr3_aux=prometheus</value>
</property>
Now every request to the Service is routed to the DAGAppMaster Pod.
With Helm, the first step can be completed by overriding the default values in kubernetes/helm/hive/values.yaml.
The field prometheus/create should be set to true in order to create a Service for Prometheus.
prometheus:
  create: true
  port: 9890
  externalIp: 12.34.56.78
Prometheus for ContainerWorkers
A ContainerWorker can run a Prometheus client to report the statistics on TaskAttempts as well as the states of Java VM.
- If the configuration key
mr3.prometheus.worker.enable.metricsis set to true inmr3-site.xml, a ContainerWorker runs a Prometheus client which creates an HTTP server on port specified by the configuration keymr3.prometheus.worker.httpserver.port. - By default, the Prometheus client exports metrics on TaskAttempts only.
- The user can export metrics on Java VM as well
(from
io.prometheus.client.hotspot.DefaultExports) by setting the configuration keymr3.prometheus.worker.enable.jvm.metricsto true.
The following table shows all the metrics on TaskAttempts. Every metric uses the ID of the ContainerWorker as its label.
| Name | Type | Description |
|---|---|---|
mr3_running_tasks |
Gauge | Number of running TaskAttempts |
mr3_heap_bytes_max |
Gauge | Size of the Java heap |
mr3_heap_bytes_used |
Gauge | Size of the Java heap in use |
On Yarn,
if multiple ContainerWorkers can run on the same node,
the configuration key mr3.prometheus.worker.httpserver.port should be set to the default value of 0
so that each ContainerWorker can choose a valid port at runtime.
On Kubernetes,
it can be set to a fixed port number because each ContainerWorker Pod is assigned a unique IP address.
On Kubernetes,
the user can create a Service for exposing the HTTP server of a specific ContainerWorker Pod to the outside of the Kubernetes cluster.
Every ContainerWorker Pod has a label mr3-worker-pod-id whose value is unique during the lifetime of the DAGAppMaster Pod.
For example, a ContainerWorker Pod mr3worker-8512-4 has a value of 4 for the label.
$ kubectl describe pod -n hivemr3 mr3worker-8512-4 | grep mr3-worker-pod-id
              mr3-worker-pod-id=4
We can create a Service of type LoadBalancer dedicated to the ContainerWorker Pod as follows:
$ vi prometheus-worker-service.yaml

apiVersion: v1
kind: Service
metadata:
  namespace: hivemr3
  name: prometheus
spec:
  type: LoadBalancer
  ports:
  - protocol: TCP
    port: 9890
    targetPort: 9890
  selector:
    mr3-worker-pod-id: "4"
  externalIPs:
  - 192.168.10.1

$ kubectl create -f prometheus-worker-service.yaml
service/prometheus created
Now every request to the Service is routed to the ContainerWorker Pod mr3worker-8512-4.
